Machine learning - Linear Regression (Part 2)
From our previous blog on Data Pre Processing , we came to know how to pre process the data. Let's work on this data set.
| YearsExperience | Salary |
| 1.1 | 39343 |
| 1.3 | 46205 |
| 1.5 | 37731 |
| 2 | 43525 |
| 2.2 | 39891 |
| 2.9 | 56642 |
| 3 | 60150 |
| 3.2 | 54445 |
| 3.2 | 64445 |
| 3.7 | 57189 |
| 3.9 | 63218 |
| 4 | 55794 |
| 4 | 56957 |
| 4.1 | 57081 |
| 4.5 | 61111 |
| 4.9 | 67938 |
| 5.1 | 66029 |
| 5.3 | 83088 |
| 5.9 | 81363 |
| 6 | 93940 |
| 6.8 | 91738 |
| 7.1 | 98273 |
| 7.9 | 101302 |
| 8.2 | 113812 |
| 8.7 | 109431 |
| 9 | 105582 |
| 9.5 | 116969 |
| 9.6 | 112635 |
| 10.3 | 122391 |
| 10.5 | 121872 |
We can call it Salary.csv
Now let's pre process the data:
Firstly importing libraries
import numpy as np
import pandas as pd
import matplotlib.pyplot as plt
Then imported the dataset
dataset = pd.read_csv('Salary_Data.csv')
Created a feature matrix with "YearsExperience" and dependent matrix with "Salary" column values
X=dataset.iloc[:,:-1].values here : means all row and then :-1 means all column except last one
y=dataset.iloc[:,-1].values here, : means all row and -1 means only the last column
Let's split the data to training and test data set
from sklearn.model_selection import train_test_split
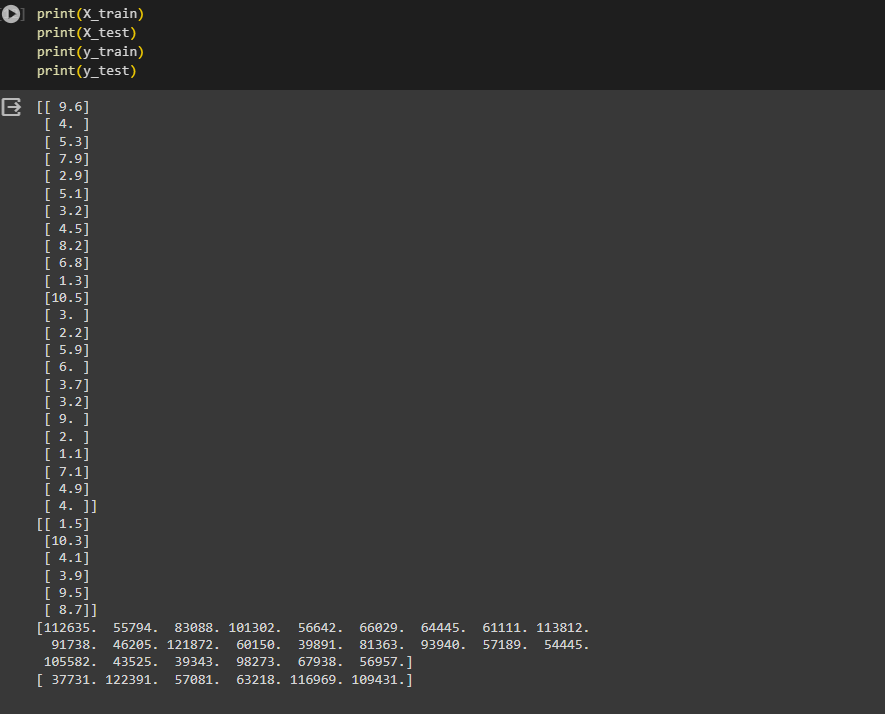
X_train, X_test, y_train, y_test = train_test_split(X,y,test_size=0.2,random_state=0) here we splitted our feature matrix (X) and dependent matrix (y) into train and test data set.
We will take 80% data for training set and 20% for testing set.
Once we print, we will get this
Let's now use the linear regression model
from sklearn.linear_model import LinearRegression here we are importing the class LinearRegression from the sklearn.linear_model
regressor = LinearRegression() here, we created an object of the class. Basically this LinearRegression() class have all of the calculations for our model.
regressor.fit(X_train, y_train) Let's now apply our training set(X_train, y_train) to this model
Again, we will create some prediction with this model
y_prediction = regressor.predict(X_test) we are using the testing set here.
That's it.
We have basically fitted our Linear Algorithm with testing data and predicted the output with testing data
Moreover, we can also see them visually:
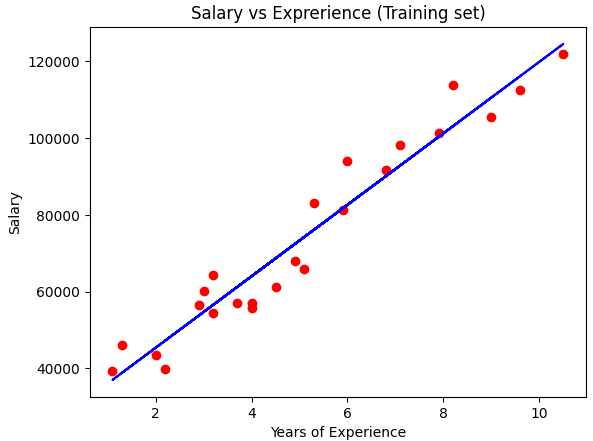
visualizing the training set
Here, red as real dots data and blue as prediction
plt.scatter(X_train,y_train,color='red') #keeping main salary using the training data to scatter in the 2D
plt.plot(X_train, regressor.predict(X_train), color='blue') creating the linear line using the linear Algorithm. X_train is used to plot and prediction was used using this X_train
plt.title('Salary vs Exprerience (Training set)') Gave a title to the plot
Did set x and y label
plt.xlabel('Years of Experience')
plt.ylabel('Salary')
Now we can see the plot
plt.show()
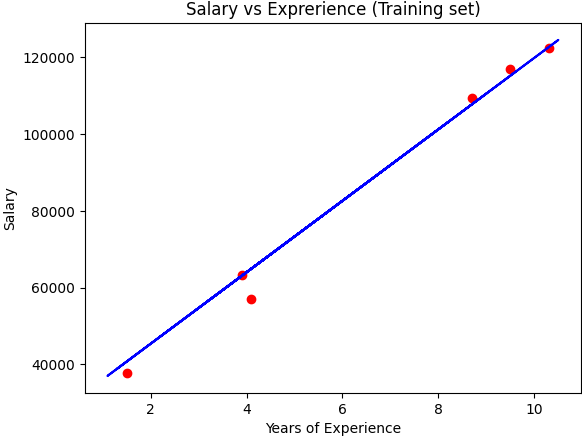
Again , we can see the result for test data using the Linear Algorithm from sklearn
plt.scatter(X_test,y_test,color='red') #keeping main salary
plt.plot(X_train, regressor.predict(X_train), color='blue')
plt.title('Salary vs Exprerience (Training set)')
plt.xlabel('Years of Experience')
plt.ylabel('Salary')
plt.show()
So, that's it. We splitted the data to training set and test set and applied the Linear Algorithm from sklearn here.
Try yourself from this link
Thank you